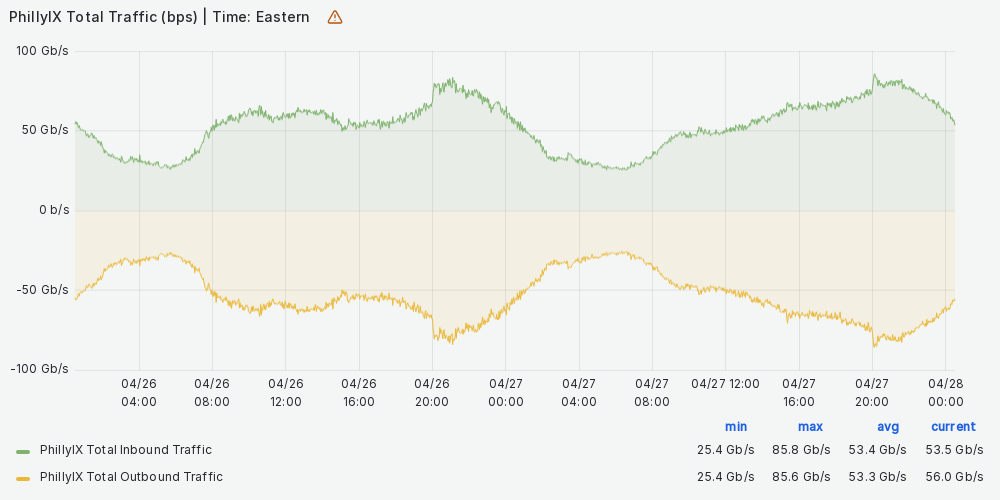
We gather statistics using SNMP polling of our switches from multiple systems. The graphs shown on this page were generated by our Grafana server. A new image is rendered every hour at half past the hour. Custom graphs for specific timeframes, or your individual port graphs are available by emailing our Admin team at admin@phillyix.net.
Please note that the system gathering these statistics lives offsite, and internet issues between our host and our Infrastructure network may affect the availability of graphs from time to time. If you see a gap in the graph, please bear with us.